Add a chart and enter data
You can present your data in a variety of two-dimensional (2D) or three-dimensional (3D) chart types, including pie charts, line charts, bar charts, column charts, and area charts. You can also create a mixed chart that overlays two chart types within the same figure, and graph data in a 2D scatter chart.
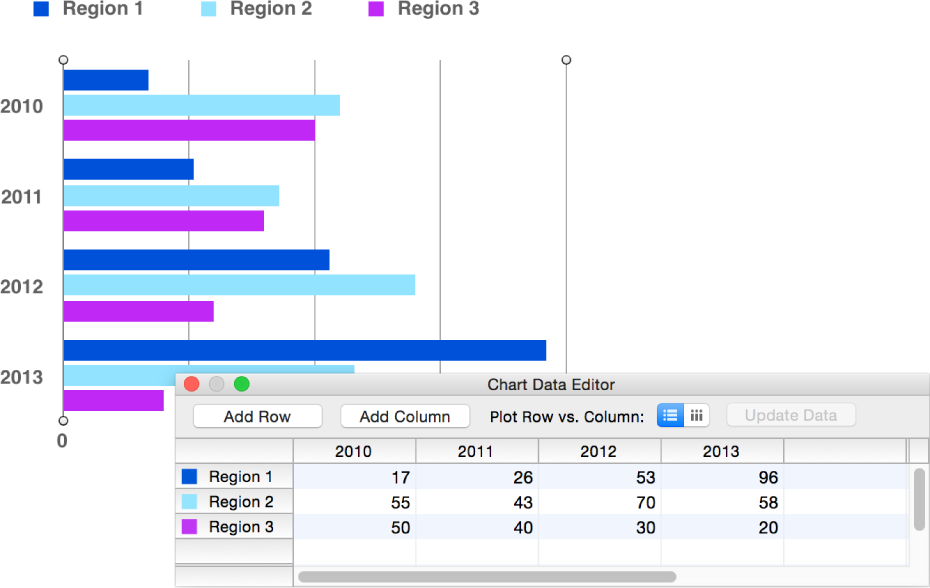
You enter your data in the Chart Data Editor, which contains a table you can edit (the table doesn’t appear in your book). As you replace the placeholder data in the Chart Data Editor, the chart is immediately updated to reflect your own data. You can copy and paste data from a spreadsheet or table.
Create a new chart
Choose a chart type from the Charts pop-up menu in the toolbar.
-
To enter your data in the Chart Data Editor, do any of the following:
Edit text (including labels): Double-click the text and type new text.
Copy data from a spreadsheet or table: Copy and paste it into the Chart Data Editor.
Reorder rows or columns: Drag a row or column label to a new position.
Add rows or columns: Click Add Row or Add Column.
Delete rows or columns: Select the row or column label, and press Delete.
-
To switch which data is plotted, click one of the “Plot Row vs. Column” buttons in the Chart Data Editor.

Drag to move and resize the chart.
Edit data in an existing chart
To edit the data in an existing chart, you open the Chart Data Editor and enter your new data. As you edit the data, the chart is immediately updated to reflect the new data.

Change a chart from one type to another
When you change from one chart type to another, the chart’s formatting might not be retained in the new chart.
Select the chart.
-
If the Chart inspector isn’t open, click Inspector in the toolbar, click the Chart Inspector button, and choose a different chart type from the pop-up menu in the upper left.
If you switch to a pie chart: The first data point in each series is represented as a wedge.
If you switch to a scatter chart: Each point in the chart requires two values. If the chart is based on an odd number of rows or columns, the last row or column isn’t plotted.
If you switch to a bar, column, area, or line chart: Each series in the new chart corresponds to a row or column in the Chart Data Editor.
If you switch to a 3D version of a chart: The Chart inspector provides controls for managing object depth, lighting style, and more.